
Continuous Improvement Program — 2024 to 2025 Annual Report
Annual evaluation
Twenty-four randomly selected impact assessments (pre-approved routine impact assessments (PRIA) and basic impact assessments (BIA)) are evaluated each year to see how well they meet the effective, efficient and compliant expected results of the Parks Canada Directive on Impact Assessment.
Figure 1. Annual review rating scale and results
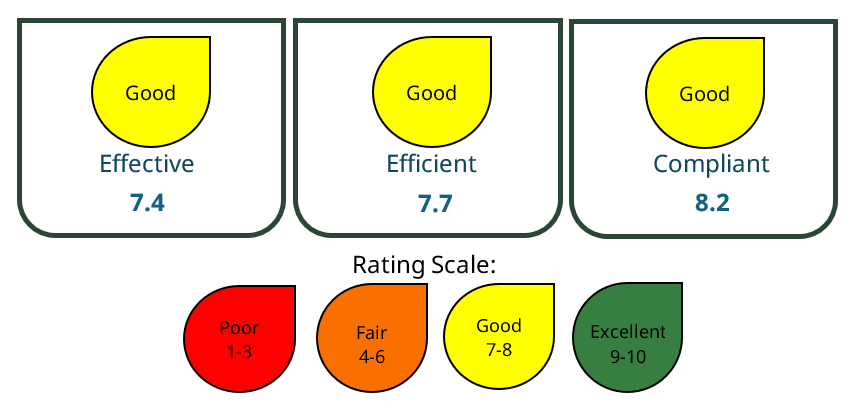
Figure 1. Annual review rating scale and results — text version
This is an infographic of the score results for the 2024-2025 annual report. The infographic includes a rating scale situated at the bottom center of the visual. The rating scale includes 4 teardrop shaped icons that indicate the different scores utilized in the report. Starting on the left, the teardrop icon outlined in black and with a background in red, identifies a Poor rating with a score between 1 and 3. Moving to the right, the second icon outlined in black and with a background in orange, identifies a Fair rating with a score between 4 and 6. The next teardrop situated to the right of the orange icon, is outlined in black with a background in yellow, identifies a Good rating with a score of between 7 and 8. The last teardrop icon found to the far right of the rating scale is outlined in black with a green background. The green icon identifies an Excellent rating score between 9 and 10. Above the identified rating scale are the results of the 2024-2025 annual report organized into three categories situated in three separate boxes. Starting on the top left side, is a medium size box with the two top corners squared and the two bottom corners rounded. The box has a dark green outline and a transparent background. All three boxes are shaped the same and have transparent backgrounds with a dark green outlining the borders. Within the first box situated on the left, there is a yellow teardrop indicating a Good rating according to the identified rating scale, situated in the top-centre. Below the yellow icon, in black bold writing the category of Effective is identified and below this is the rating of 7.4 for this category. The second medium sized box is situated in the center of the visual. Within the box, a yellow teardrop icon indicating a Good rating scale is situated in the top-center. Just below the yellow icon, the category is identified in black bold writing as Efficient. Below the identified category is a score of 7.7. The last green outlined box of the three, situated to the right of the visual, includes a yellow teardrop icon indicating a Good rating according to the rating scale. Below the yellow icon written black and bold is the identified category Compliant. Lastly situated below the identified category within this box is the rating score of 8.2.
Highlights
- Appropriate impact assessment pathways were selected with a high degree of accuracy
- BIAs were generally well prepared and efficient, with strong scoping of valued components, clear identification of mitigation measures, and appropriate depth of analysis
- Further improvement is needed in the analysis of residual effects
- A key area for improvement is the clear and consistent documentation of legislative and policy compliance, including consultation requirements, as well as surveillance and follow-up monitoring obligations
Key recommendations
- Develop a Pathway Selection Toolkit to support transparent and defensible impact assessment (IA) pathway decisions
- Review and improve the internal BIA Guide and related communications to clearly outline IA requirements, helping ensure their consistent consideration in BIA reports
- Promote new training modules focused on evaluating residual effects and significance
Key investigation
The 2024-25 key investigation focused on detailed impact assessments (DIA). This topic was selected as DIAs are not currently included in the scope of the annual evaluation. As five years have passed since the implementation of Park’s Canada’s internal DIA guidance, this investigation provided an opportunity to begin examining trends and assessing the effectiveness of DIA-related documentation processes.
Information was gathered and analyzed from the internal DIA tracking list and pathway decision records for all twenty-five DIAs completed over the past five years.
Highlights
- Future tools, guidance, and process improvements should ensure that internal project teams have the support needed to plan for and deliver projects that require a DIA
- There is an opportunity to explore how existing approaches used to evaluate conservation and restoration projects (for example evidence-based conservation, conservation standards) could better integrate impact assessment requirements to streamline delivery
- Available DIA scoping tools do not consistently support clear communication, and potential risks, while they may be considered, are not always well documented in decision tools
Key recommendations
- Update IA pathway documentation to enhance clarity and justification for selecting the appropriate IA pathway
- DIA toolkit development to strengthen documentation of DIA pathway and scoping decisions, and communication of risk to decision-makers
- Regularly review DIA metrics to improve tracking of trends and measures of effectiveness
- Date modified :